


I opened my Google analytics dashboard today. The stats of my website went ballistic in the last week. The new Google update about its broad core algorithm somehow is having a positive effect. I recorded a massive 230% increase in my blog traffic. One important task that I always do is the website speed test. In this article, we will take a look at GTmetrix Vs Pingdom vs Webpagetest tool and its features. Website speed check tools play an important part in amplifying your website SEO.
One of the important tasks that I have every morning is doing the website speed test of my blog. GTmetrix, Pingdom, and webpagetest are the three topmost testing sites.
I do this without fail. So let me show you how I am able to get less than 3 seconds load time of all speed testing tools. Besides showing you the speed stats for my blog, I would also tell you why different website owners choose different speed tools as per their website structure.
So, I got up today and started my blog work by web page speed test. As usual, I went to GTmetrix, Pingdom, and webpagetest to check the speed. I am going to share the stats with you.
GTmetrix

I am in love with this tool. GTmetrix not just tells me my website load time, but also tells me what areas I need to work on to improve my load speed.
Pingdom

Pingdom is a Swedish website monitoring platform. They were acquired by Austin based solar winds.
Webpagetest

This is again one of the top three website speed test platforms. Furthermore, this website speed check tool gives out a very detailed analysis of your website.
Now if you think that getting the above results which are excellent is easy, not it’s not. I have worked hard to get this speed. I have optimized and covered every loophole which was increasing my site speed.
At first website speed tests are confusing
Yes, these platforms spit out tons of data and analysis. For someone who just started their website might get confused. Furthermore, you might get confused as to which metric to look at and which one to pass.
EVERY METRIC IS IMPORTANT.
At first, when I started blogging, these speeds were too confusing for me. Even now, if you are looking at the above screenshot almost all of you are confused. Why the speed is shown by GTmetrix is 2.4 seconds, on Pingdom 760 ms and, on webpagetest, it’s 2.17 seconds.
So you might be wondering which one is actually correct? I wondered the same and then started digging down further. Let me show you why these speeds are different, and most noteworthy give you a detailed analysis and comparison of GTmetrix Vs Pingdom Vs webpagetest.
So let’s get techy.
The speeds are calculated based on different indicators. Let me take you through these indicators one by one.
Test Location

My blog site is hosted on a server located in Chicago. The distance between the hosting server location and testing server location plays an important role in determining speed. You can check your hosting location here.
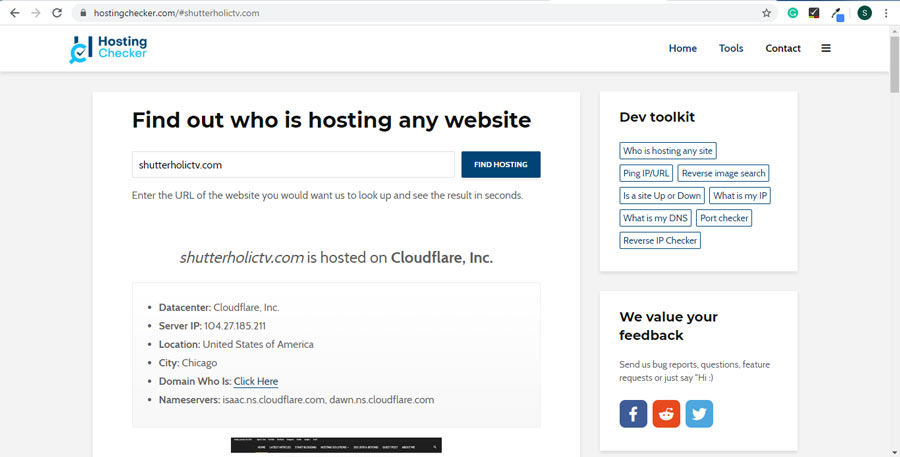
So consider this, the hosting server location for my blog is in Chicago. The testing server of GTmetrix is in Vancouver Canada, The location for the Pingdom testing server is somewhere in the western US (They did not specify which city though) and for webpagetest, the location is Dulles VA.
Now let us look at the location distance comparison of their servers from my hosting server location.
| Hosting Server | Testing Server | Testing Server Location | Geographical Distance | Site Speed |
| Chicago, Illinois, USA | Gtmetrix | Vancouver, British Columbia, Canada | 3539 KM | 2.4 Seconds |
| Chicago, Illinois, USA | Pingdom | New York, USA | 1269 KM | .76 Seconds |
| Chicago, Illinois, USA | Webpagetest | Dulles, Virginia, USA | 1113 KM | 2.17 Seconds |
The above table shows that the more the distance more is the load time with Pingdom as an exception. Pingdom is an exception as there are more factors to consider while calculating page speed. We will discuss all those articles here.
When you test the site speed with various testing server location speed always varies. This is because a change in the distance means a change in the quality of the network and latency.
So which server location is the best? Answer: Depends on your traffic, If my visitors are from a specific location I would test my site with the server from that specific location.
Let us look at the server locations for Gtmetrix vs Pingdom Vs webpagetest.

Webpagetest is able to have so many locations as anyone can host a location for them on their server. However, each server will have different hardware and hence the difference in the speed because of the difference in performance.
Testing TAT in web page speed test

Supposing you are checking the speed of your website in any of the Website speed check tools. The moment the tool starts analyzing your website when you click start to the point where the analysis is over, that is called testing TAT.
If you start the testing on Gtmetrix Vs Pingdom Vs webpagetest at the same time, you will be surprised that the testing TAT is not the same for all of them. Different tools decide differently when it comes to stopping website analysis.
Let me tell you why?
The website speed analysis end is determined by two loading mechanisms. These two mechanisms decide when to stop the analysis of a particular website. Let us discuss this in detail.
Loading Mechanisms
Onload Time: This loading mechanism means that the webpage has finished serving all the resources including text, images, and scripts. There might be other requests initiated by some custom coded JavaScript after the onload time that may result in inconsistent load time.
A classic example is of exit pop up. This popup gets loaded when a user decides to leave the webpage. So this resource is not taken into consideration when calculating load time is the platform uses onload time as a loading mechanism.
Fully Loaded Time: This is a measure of when a user comes to your site and your website serves all the content including all script which was not being considered in the above onload time.
In other words, the time when you arrive on a webpage till the time there is no buffering of network activity. In this kind of loading mechanism that load time is generally longer as the testing platform waits for all the resources to load.
Now let us look at these loading mechanisms with respect to our testing tools.
GTMetrix: It has full load time as default with an optional onload mechanism for testing. (My blog result 2.4 seconds)
Pingdom: Onload time mechanism only (Now you know why I got a blazing load time of .76 second. (My blog result 0.76 seconds)
Webpagetest: It has full load time as default with an optional onload mechanism for testing. (My blog result 2.17 seconds)
Another classic example is a slider. When websites using sliders test their speed, the first image of the slider is taken into consideration for speed and the testing stops. However, other slider images still might be loading which is not considered. So choosing the testing platform depends on what mechanism exactly you want to test.
Performance & Speed recommendation in website speed check tools
Web page speed tests will always differ because each of the testing platforms uses its own set of hardware configurations and speed recommendation factors. Take a look at the webspagetest custom 6-speed parameters.

GTmetrix: They use Google recommended 27-page speed contributors & 19 Y-slow page speed recommendations. In case you are wondering what is Y-Slow in GTMetrix, this is Yahoo’s way of speed factors on which they judge high-performance websites.
Pingdom: They use 11 Google recommended page speed contributors in their free version. In paid they use more recommendations however, there is not concrete or substantial data for it.
Webpagetest: In the above screenshot it is quite clear that webpagetest uses a set of 6 Google recommended custom factors. So these platforms use a different set of Google recommended factors individually that make them different and also they give our different speed statistical data.
Extra Features in web page speed test

Coming to the final point of speed testing between GTmetrix vs Pingdom Vs webpagetest. These platforms also lure more traffic and users by giving or testing their websites on some additional features or metrics. Let us understand them one by one.
Note: You might need to switch to a paid account with these platforms in order to get these extra features.
Using Real Browser Like Chrome
There a number of website speed testing platforms, however, the three in discussion tops the charts. This is because they use real browsers when testing websites rather than using virtual or emulated browsers.
In this way, they are able to tell an accurate speed of the website bypassing all the emulated or virtual factors. They use Chrome by default which is the most used browser in today’s world. This way they are able to judge what the user will actually see and encounter when they land on your website.
Additional Support form HTTP/2
For people who are not familiar with HTTP/2, this is a revised version of HTTP/1 which was a further refined version of HTTP. HTTP/2 is much more advanced than HTTP/1 and HTTP. Furthermore, this helps in multiplexing and concurrency. Concurrency means the passing of several requests on the same TCP connection.
Also, HTTP/2 supports include benefits like stream dependencies, header compression, and server push. When HTTP/2 is implemented it gives a boost to the website speed. However, for this feature to work both the host and client-server need to have HTTP/2 support on their servers.
As per a study done by W3TECHS around 42.9% of the websites all over the world use this technology.
Hardware configuration
GTmetrix, Pingdom & webpagetest use different server configurations. As a result of which site speed statistics are impacted and are different when using different platforms.
GTmetrix & Pingdom have different guidelines when using different testing servers at different geographical locations. They are so much fine-tuned that the difference in speed from different locations are almost similar.
Unlike webpagetest which lets you host their services as long as you have a server with minimum configuration met, GTmetrix and Pingdom have stringent server hosting criteria.
Connection Throttling
How fast your users can connect with your website on different internet connections will change your site speed statistics. For e.g. someone using a 3G connection might get the website loaded faster than someone using a 2G.
Pingdom does not have this feature where you can simulate different internet connections and test speed on different connections. However, GTmetrix and webpagetest can help you simulate different internet connections to check speed on different metered connections.
Below is the breakup of GTmetrix & webpagetest simulated internet connecting support.
GTmetrix: Cable, DSL, 3G mobile, 2G mobile, and 56K dial-up
Webpagetest: Cable, DSL, 3G Slow, 3G, 3G Fast, 4G, LTE, Mobile Edge, 2G, 56K dial-up, FIOS, Native Connection, and custom speed
Mobile Testing
Almost 60% of the searches in today’s internet world is done on a mobile device. Be it mobile or tablet, it is important for you to optimize your website as per mobile visibility too.
Out of these three website speed check tools, Gtmetrix and webpagetest both give you an insight into mobile testing. Webpagetest has emulated around 14 mobile devices as a part of their mobile testing suite. All you need to do is choose the mobile device to choose the server testing location from the drop-down to test.
Gtmetrix, on the other hand, uses galaxy nexus mobile phones to test the mobile speed. They know that the searches are more on mobile phones than desktops. So they have prioritized their testing server for mobile testing first. However, in GTmetrix the mobile testing is only available for the Vancouver server.
Summing up the page speed test article
I hope I have cleared all the doubts when it comes to the comparison between Gtmetrix Vs Pingdom Vs webpagetest. These website speed check tools are brilliant and give thoughtful insights into your website speed.
Each of these web page speed test tools is different and gives out different metrics based on the factors listed above. Deciding which tool to use can be tricky, however, let me put up a shot selection help module for everyone.
When it comes to…
General Testing of your website: GTmetrix, Pingdom, Webpagetest
Historical Testing of your website: GTmetrix & Webpagetest
Comprehensive testing of your website: GTmetrix & Webpagetest
Location Testing of your website: GTmetrix, Pingdom, Webpagetest
Advance Testing of your website: GTmetrix & Webpagetest
THAT’S WHY I LOVE GTMETRIX WHEN IT COMES TO TESTING MY BLOG.
If you have any questions related to checking the speed of your website please drop them in the comments below. I will get back to you as soon as possible.


